|
|
02 Features
Cereal Foods World, Vol. 63, No. 5
DOI: https://doi.org/10.1094/CFW-63-5-0207
Print To PDF
DisplayTitle Navigating Protein Claim Regulations in North America for Foods Containing Plant-Based Proteins
Authors Christopher P. F. Marinangeli,1,2 Wilfredo D. Mansilla,3 and Anna-Kate Shoveller3
Affiliations 1 Pulse Canada, 1212 Portage Ave, Winnipeg, MB R3C 0A5, Canada.
2 Corresponding author. Christopher P. F. Marinangeli, Director, Nutrition Science and Regulatory Affairs, Pulse Canada, 920-220 Portage Ave, Winnipeg, MB R3C 0A5, Canada. E-mail: cmarinangeli@pulsecanada.com
3 Department of Animal Biosciences, University of Guelph, 50 Stone Rd E, Guelph, ON N1G 2W1, Canada.
Abstract
CFWAbstract Protein content claims in Canada and the United States are based on the overall quality of the protein in a given food. The purpose of this review is to discuss the current regulatory landscape for protein content claims in North America and the associated challenges for helping consumers adopt dietary patterns with higher levels of plant-based proteins. Use of the protein rating/protein efficiency ratio (PER) method for determining the protein quality of foods in Canada can be more restrictive than the protein digestibility corrected amino acid score (PDCAAS)-based system adopted in the United States. Adoption of PDCAAS in Canada could help address some of the challenges associated with the protein rating/PER method and further efforts to harmonize regulations with the United States. Moreover, acceptance of in vitro methods for estimating the true fecal nitrogen digestibility of protein to calculate PDCAAS values would also expedite product innovation utilizing plant-based proteins in both countries. Removal of protein quality as support for protein content claims in North America and movement to a system based on protein content would align with regulations in other regions, as well as Codex standards. Dietary patterns, health, and environmental well-being continue to be highlighted as the three pillars of sustainability for the food industry, and regulatory frameworks used in North America must be adapted to help drive changes in consumer behavior.
Trying to reach content?
View Full Article
if you don't have access, become a member
Page Content Over the last decade, protein has been a major driver of purchasing decisions made by consumers (43). As the appeal of plant-based foods for consumers continues to grow, it is not surprising that foods containing plant-based proteins are becoming increasingly prominent within the North American marketplace (22,31). Simultaneously, given their ties to human health (24) and environmental sustainability (40,47), plant-based proteins are being highlighted within dietary guidelines across jurisdictions, including North America (15,29,32,50). Although plant-based protein sources, including legumes (soybeans, pulses), nuts, and seeds, have always been available, the food industry is responding to dietary guidelines and consumer trends with innovative and reformulated foods that are underpinned by significant levels of plant-based protein per serving (22,31). Due to increased interest in the use of plant-based proteins, in 2018, the government of Canada announced a CA$150 million investment to help develop Canada’s plant-based protein sector (1).
Protein content claims are used by consumers to identify foods as a source of dietary protein. Regulatory guidance for “source of protein” claims differs across jurisdictions. Compared with other developed regions, such as Australia and New Zealand (11), China (30), and the European Union (7), the regulatory environments in Canada and the United States are unique, because protein content claims are dependent on protein quality. In Canada and the United States, for persons ≥1 year of age, the protein quality of a food is quantified using the protein efficiency ratio (PER) method to derive a protein rating (17) or a protein digestibility corrected amino acid score (PDCAAS) (53), respectively. Plant-based sources of protein generally have lower levels of indispensable amino acids (mg/g of protein) and lower digestibility coefficients compared animal-based protein sources, which affects their measured protein quality. That being said, in the context of the total diet, these properties of plant-based protein sources do not necessarily devalue their contribution of protein to a healthy diet. From a regulatory perspective, these methodologies can introduce challenges for establishing “source of protein” claims for plant-based foods. The inability to identify for consumers foods with significant levels of plant-based protein could impede the adoption of dietary patterns that align with dietary guidelines.
Moreover, given the similarities and shared food systems between Canada and the United States, many of the same manufactured foods can be found in retail outlets in both countries. However, because of differences in regulatory frameworks concerning protein, some foods that can be identified as a “source of protein” in one country cannot make a similar claim in the other.
The purpose of this review is to discuss the current regulatory landscape for protein content claims in North America and outline possible modifications to the regulatory frameworks that would increase the ability of manufacturers to communicate to consumers in Canada and the United States that foods are a significant source of plant-based protein.
Regulatory Landscape for Protein Content Claims in Canada and the United States
Protein quality is assessed based on the ability of a dietary protein to provide adequate levels of bioavailable essential or indispensable amino acids for metabolic work (27). For humans, nine amino acids are indispensable and are required at variable levels, depending on life stage and state of health (21).
Various methodologies have been developed to assess the protein quality of foods. However, few have been integrated into existing regulatory frameworks to support protein content claims. Canada and the United States are exceptions, however, and have implemented different methodologies for determining protein quality to support protein content claims for foods that target noninfant populations.
Support for Protein Content Claims in Canada. A summary of the protein rating method used to support protein content claims in Canada is provided in Figure 1 (26). To determine the protein rating of a food, a rat bioassay is used to measure its PER. Weanling rats are fed diets containing a test protein (10%) or control protein, casein (10%). After 4 weeks, the protein efficiency (weight gain [g]/protein intake [g]) is determined for each diet. The ratio of the protein efficiencies between the test and control diets is the PER. To account for inter- and intralaboratory variability, the calculated PER is adjusted using the standard average PER for casein of 2.5. For the remainder of this review, PER refers to the adjusted PER value (13). The protein rating is determined by multiplying the PER of the protein source by the Reasonable Daily Intake (RDI) value established for the same food (3). A food with a protein rating ≥ 20 is a “good source” of protein, whereas a food with a protein rating ≥ 40 is an “excellent source” of protein. RDI values for specific foods are available in schedule K of Canada’s Food and Drug Regulations (3). If an RDI for a food does not exist, the reference amount, which is the regulated serving size of a food, can be used to determine the protein rating (3). 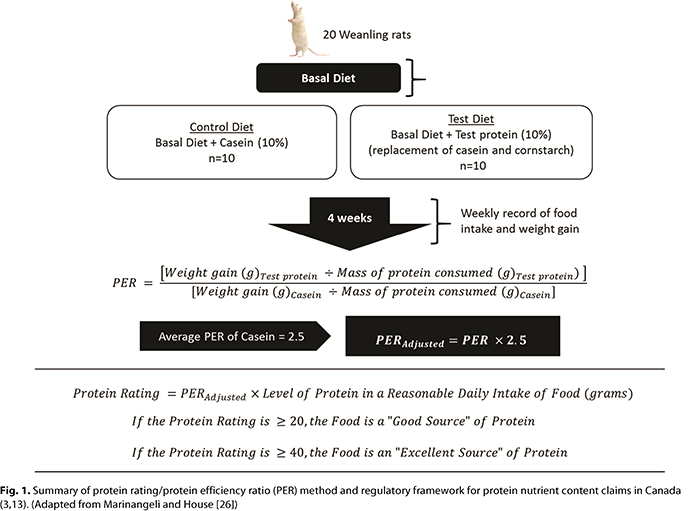
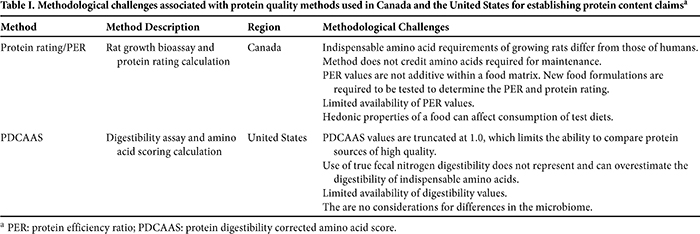
The methodological challenges associated with using the protein rating method to delineate the protein quality of a food and its subsequent use within a regulatory framework are outlined in Table I. First and foremost, the use of a growing rat does not accurately assess the indispensable amino acid requirements of humans. This is particularly true for sulfur-containing amino acid requirements, which are elevated in rats due to their role in fur production and maintenance (10,41). The utility of the protein rating method is further challenged as a growth assay, because indispensable amino acids necessary for maintenance of tissues and biological processes are not credited (10). Additionally, given that the PER is highly dependent on the consumption of test foods by rats, the hedonic properties of a test food could alter consumption and produce an artificially low or high PER. Furthermore, nutrient geometric analyses used to evaluate how mixtures of nutrients affect dietary choices suggest that protein intake in humans is more strongly regulated than carbohydrate and fat intakes (45): dietary intake is about 15% protein and 85% carbohydrate and fat. Although protein content also drives macronutrient selection in rats, Simpson and Raubenheimer (46) found that adult male Sprague-Dawley rats generally selected about 40% protein and 60% carbohydrate and fat. In addition, the protein/energy ratio may change depending on environmental temperatures, e.g., rats will maintain their protein intake but selectively increase energy intake from fat and carbohydrate. These results demonstrate differences in the dietary preferences of humans and rats.
Few PER values exist in the peer-reviewed, private, and regulatory literature that can be used for application within the regulatory frameworks to establish protein content claims. The Canadian Food Inspection Agency (CFIA) provides a limited list of PER values for the food industry (3), and because PER values are not additive, new food formulations containing a mixture of protein sources require that the PER be determined using the rat bioassay. In our opinion, this requirement can limit food innovation because of the cost and difficulty associated with making a protein content claim for mixed foods. It is noteworthy that in Canada unless a food can be characterized as a “source of” protein (protein rating ≥ 20), the level of protein per serving of food cannot be advertised to consumers other than in the Nutrition Facts table on the label (16). Regulations are similar in the United States, where rules concerning the use of nutrient content claims extend to any statements on labels about the level or range of a nutrient, including protein, in a food (52).
Support for Protein Content Claims in the United States. In the United States, PDCAAS is the regulatory tool used to support protein content claims. The PDCAAS method relies on in vivo true fecal nitrogen digestibility coefficients, the indispensable amino acid requirements of a human reference population, and the level of indispensable amino acids (mg/g) of each protein source in a food formulation (Fig. 2). The level of each indispensable amino acid is divided by the indispensable amino acid requirements of a reference population and is defined as the amino acid score (10). The indispensable amino acid with the lowest score is multiplied by the weighted average for true fecal nitrogen digestibility to derive the PDCAAS of the food. PDCAAS values > 1.0 are truncated at 1.0 (10). The PDCAAS is multiplied by the level of protein in a serving of food, which adjusts the level of protein in the food for digestibility. In the United States, the serving size used for this calculation is the reference amount customarily consumed (RACC), which is outlined in Title 21, Section 101.12 of the U.S. Code of Federal Regulations (54). The level of corrected protein per RACC is divided by the daily value (DV) for protein for individuals who are ≥4 years of age (50 g). For foods targeted to children 1–3 years of age, the DV for protein is 13 g/day (53). If the food contains ≥10% of the DV for protein per RACC, the food is a “good source” of protein. If the food contains ≥20% of the DV for protein per RACC, the food is an “excellent source” of protein (51). 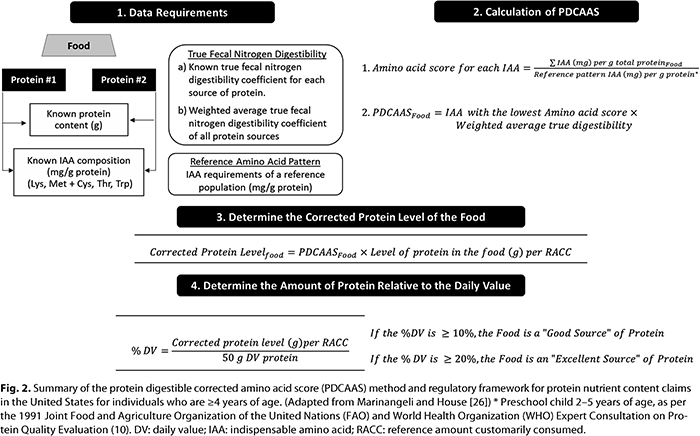
The PDCAAS was adopted in the United States as the framework for supporting protein content claims following the publication of the 1991 Joint Food and Agriculture Organization of the United Nations (FAO) and World Health Organization (WHO) Expert Consultation on Protein Quality Evaluation (10). Although indispensable amino acid requirements in reference populations have changed over time (8,10,56), regulations in the United States stipulate that the indispensable amino acid requirements for children 2–5 years of age, based on the 1991 report, remain in use (53). Growth rate and higher protein requirements are the rationale for using children 2–5 years of age as the reference population.
From a nutritional perspective, the PDCAAS largely addresses the shortfalls of the protein rating method used in Canada to support protein content claims. However, this has not stemmed criticisms. For foods with a PDCAAS > 1.0, the truncation of values to 1.0 does not permit high-quality protein sources to be accurately compared (8). Furthermore, the use of total fecal nitrogen digestibility does not accurately represent the digestibility of each indispensable amino acid or account for microbial assimilation and uptake of endogenous and exogenous nitrogen in the large intestine, which can inflate digestibility values, and, thus, the PDCAAS of a protein source (9,39,42,56).
That being said, in contrast to the protein rating method used in Canada, PDCAAS values can be added together (10,56), eliminating one of the barriers encountered when using the protein rating method. Therefore, if digestibility coefficients and indispensable amino acid levels for each protein source are known, the PDCAAS can be derived for foods with multiple protein sources without the need for an in vivo total fecal nitrogen digestibility study. However, a lack of total fecal nitrogen digestibility values for new ingredients can limit the calculation of the PDCAAS and require assessment based on rat balance studies.
Protein Quality of Plant-Based Protein Sources
In general, regardless of the methodology used, the protein quality of plant-based protein sources is lower than that of animal-based sources. Plant-based protein sources can have lower total fecal nitrogen digestibility coefficients and/or lower levels of one or more indispensable amino acids compared with animal-based proteins. The lower digestibility values of plant-based protein sources can be secondary to the inherent structure of the protein and the presence of nonprotein constituents in plant-based foods such as fiber and antinutritional factors (10). Most antinutritional factors that disrupt protein digestion are inactivated by cooking and/or processing (38). Nonetheless, lower digestibility and/or indispensable amino acids levels can decrease the PER and PDCAAS values for a food. Typically, legumes have higher levels of lysine (mg/g of protein) and lower levels of sulfur-containing amino acids (mg/g of protein), whereas the reverse is true for cereals. Thus, it is recommended, particularly for vegetarians, that diets include plant-based proteins from a variety of sources, such as legumes, cereals, nuts, and seeds, to ensure daily requirements for indispensable amino acids are met. This approach has long been accepted as combining “complementary proteins” and is the backbone of animal nutrition when complementary sources and supplemental amino acids are used in formulating diets to balance the dietary amino acid profile (44).
Some PER and PDCAAS values for a variety of animal- and plant-based protein sources are summarized and ranked (from highest to lowest) in Table II. It should be emphasized that the data presented in Table II are a summary of publicly available data, and PER and PDCAAS values for similar foods listed could be higher or lower because of differences in variety, production, and processing. As expected, for the most part, lower PER values are derived for plant-based protein sources compared with animal-based foods. Exceptions include soybeans, soy protein, and chickpeas, with PER values of 2.0, 2.3, and 2.32, respectively. Despite observing reasonably high true nitrogen digestibility values, the same trends are apparent for PDCAAS, in which plant-based proteins generally have scores that are ≥30% lower than those for animal-based protein. Similar to PER, PDCAAS values for soy proteins are similar to animal-based proteins. 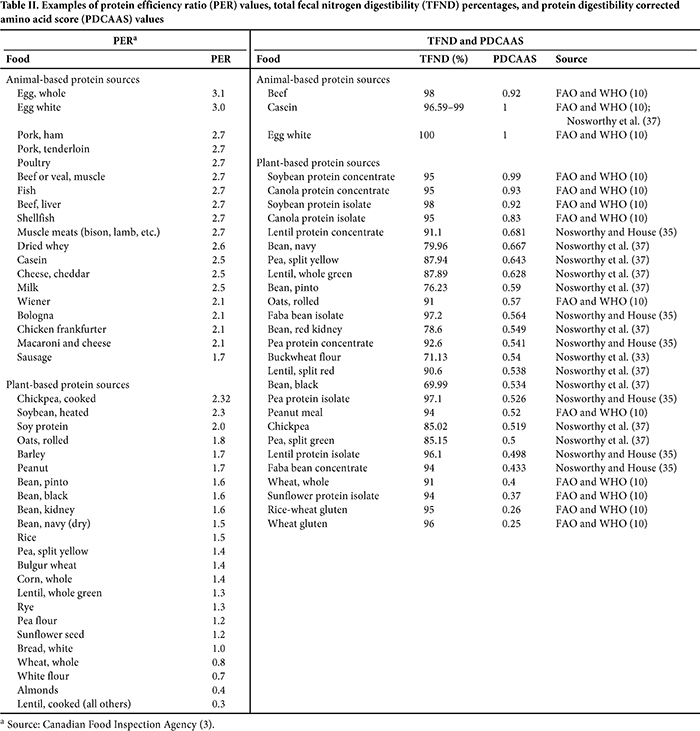
Protein Nutrient Content Claims for Plant-Based Food Sources in Canada and the United States
As dietary guidelines place increased emphasis on the consumption of plant-based protein sources, it is reasonable to suggest that significant utilization of legumes, cereals, nuts, and seeds in food formulations should render those foods a source of protein and, in particular, provide greater guidance for those who choose to eliminate or limit consumption of animal-based proteins. Given that Canada and the United States use two different regulatory frameworks to support protein content claims, it is expected that each framework would yield different results under the context of protein claims.
One of the challenges created by having two very different methods for assessing protein quality across regions with similar food landscapes is demonstrated by lentils and chickpeas. As shown in Table II, the PER for lentils, with the exception of green lentils, is extremely low at 0.3 and would produce a very low protein rating of 2.8 (based on 0.074 g of protein/mL in cooked lentils [U.S. Department of Agriculture (USDA) National Nutrient Database (NDB) ID 16070 (48)] and a 125 mL reference amount [14]), which is 86% below the protein rating (≥20) required to permit a protein claim in Canada. Based on the averaged protein content of cooked lentils (9.02 g/100 g [USDA NDB ID 16070 (48)]), a general PDCAAS for canned lentils of 0.52 (10) and a 90 g RACC (54), the corrected level of protein per RACC is 4.22 g. Although the corrected level of protein falls short of the threshold for a protein claim in the United States (5 g of corrected protein/RACC), the shortfall of 16% is modest and provides a reasonable opportunity to combine lentils with a complimentary protein source or sources to attain levels that would facilitate a claim. Furthermore, as demonstrated in Table III, the PDCAAS for green lentils is 0.628 and is high enough for a protein claim to be made in the United States based on a 90 g RACC, but it is not high enough for a claim to be made in Canada. The reverse is true for chickpeas, for which the PER is 2.32—a ratio which, relative to the casein positive control, could generate a fairly high protein rating for food with moderate-to-high levels of protein. Conversely, the PDCAAS for chickpeas is 0.519, which is 50% lower than that of animal-based protein foods. Thus, the use of chickpeas in a manufactured food product may enable a protein content claim in Canada, but not in the United States. 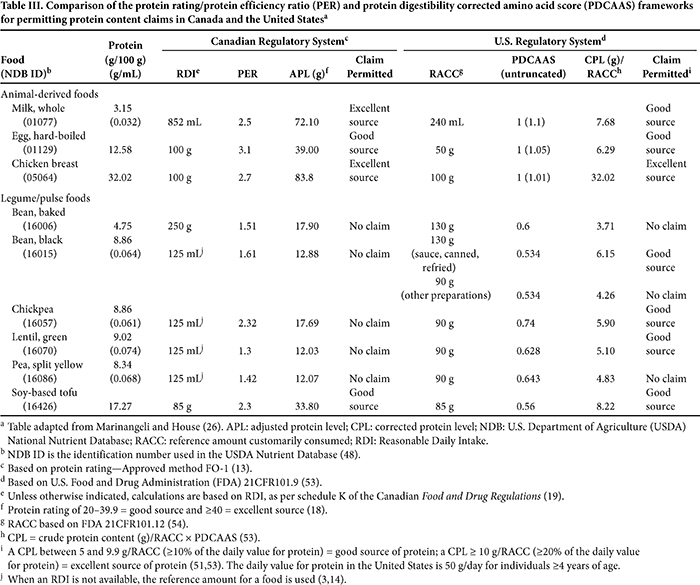
The application of PER and PDCAAS for protein content claims in Canada and the United States, respectively, for whole foods that dietary guidelines identify as foods with protein is summarized in Table III (20,49). In Canada and the United States, animal-derived protein foods, such as milk, eggs, and chicken, are considered to be “good” or “excellent” sources of protein. In contrast, no legumes, with the exception of tofu made from soybeans, are considered to be a “source” of protein in Canada. In the United States, however, all legumes, with the exception of baked beans, black beans (no sauce and/or not canned in liquid), and split yellow peas, are considered “good” sources of protein.
Flours, protein concentrates, and protein isolates are ingredients that can be utilized to facilitate an increase in the consumption of plant-based protein. Recently, Chaudhary et al. (4) evaluated the effects of reformulation of pan bread, breakfast cereal, and pasta with whole yellow pea flour. Refined high-protein, all-purpose, or semolina wheat flour was replaced with whole yellow pea flour at 15, 53, and 30% total flour, respectively. Using the known amino acid composition of the refined wheat flours and whole yellow pea flour and their known true fecal nitrogen digestibility, the PDCAAS and corrected levels of protein per serving of foods from the Chaudhary et al. (4) study was modeled against the RACC for bread (50 g), breakfast cereal (40 g), and pasta (dry) (55 g). Reformulation with whole yellow pea flour increased protein quality by 41% for pan bread, 111% for breakfast cereal, and 100% for pasta (Fig. 3A). The respective corrected protein levels also increased by 51, 201, and 128% for pan bread, breakfast cereal, and pasta (Fig. 3B). Levels of corrected protein that would permit a protein content claim in the United States (5 g/RACC) were attained for reformulated pasta, but not for reformulated pan bread or breakfast cereal (Fig. 3B). This was true even when reformulation was modeled to a 100% inclusion rate of whole yellow pea flour. These results demonstrate some of the technical and communicative challenges concerning reformulation and innovation with plant-based proteins. 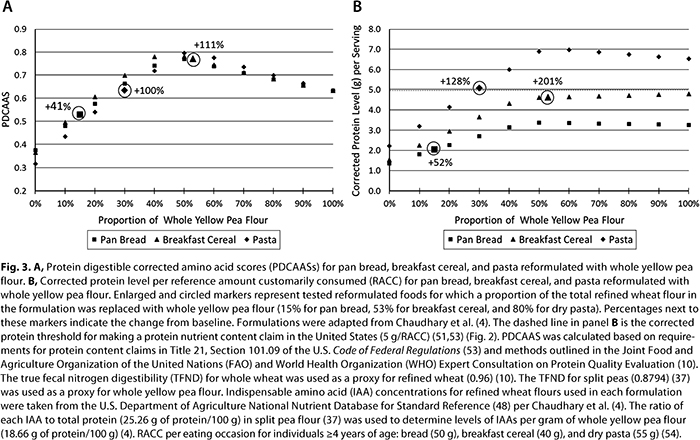
Debating the Future of Protein Content Claim Regulations in North America
Across regions, dietary guidelines and government agencies (2,12,23,29,32), as well as the guiding principles for the next iteration of Canada’s Food Guide (15), emphasize consumption of plant-based sources of protein to facilitate health and/or decrease the environmental impacts of diets. Lack of harmonization between Canada and the United States could impede the development and marketing of food offerings that align with dietary guidelines to increase consumption of plant-based proteins. Given the heightened awareness concerning the impact of food choices on health and environmental sustainability, there is an interest in exploring regulations that govern protein nutrient content claims in Canada and the United States. Analysis should determine whether current frameworks are sufficient to enable a food landscape that credits the positive nutritional attributes of foods and facilitate healthy food choices by consumers.
The use of protein quality as support for protein content claims in Canada and the United States is intended to facilitate the consumption of healthy diets. However, the frameworks for protein content claims in Canada and the United States assume that a threshold for indispensable amino acids must be met for every food and/or meal and that deficits from one eating occasion cannot be compensated for at other eating occasions or by inclusion of complementary protein sources within a meal. Given the variety of foods available and recommendations to increase the proportion of plant-based foods as part of healthy dietary patterns, there is merit in reexamining protein quality-based regulatory frameworks for protein nutrient content claims in Canada and the United States to ensure they align with dietary guidance and do not confuse consumers.
Some disadvantages of the protein rating/PER method have been discussed in this review, and it would seem that Canada’s transition to PDCAAS as support for protein content claims would be, at least in the interim, a logical approach for modernizing protein claim regulations. The CFIA has outlined that, when PER values are not available, or when foods contain multiple protein ingredients, the PDCAAS methodology can be used. Subsequent to deriving a PDCAAS for the food, the CFIA suggests that the PDCAAS be multiplied by 2.5 (the PER for casein) to derive an adjusted PER for the food, from which the protein rating can be calculated (3). However, the conversion of PDCAAS to PER outlined above has not been validated and does not necessarily address the fundamental challenges inherent within Canadian regulations (25).
PDCAAS is also not without its challenges. As demonstrated in Table III, some foods, such as black beans (no sauce and/or not canned in liquid) and peas, which are suggested sources of plant-based protein in the USDA Dietary Guidelines for Americans (49), may not meet thresholds for protein content claims in the United States. The use of rat balance studies to determine true fecal nitrogen digestibility is also time-consuming and costly. The acceptance of in vitro methods to determine true fecal nitrogen digestibility could be a solution to expedite the determination of digestibility coefficients of new foods. Studies by Nosworthy et al. (33–36) have demonstrated that, whereas in vitro digestibility analysis underestimates nitrogen digestibility compared with in vivo methods, coefficients of determination between in vivo PDCAAS and theoretical PDCAAS are >0.9. This relationship is illustrated in Figure 4 for pinto bean and buckwheat flours subjected to various cooking and processing methods (33). Results from Nosworthy et al. (33–36) suggest that in vitro digestibility coefficients and regression analysis can be used to derive the PDCAAS for foods to determine whether they would qualify for a protein content claim in the United States. 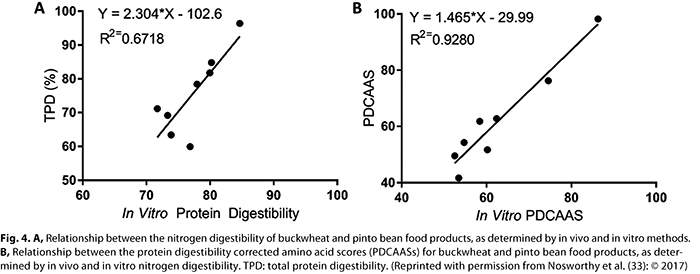
Moving forward, it is important to acknowledge recent discussions regarding the best approaches for determining the protein quality of foods. In 2013, the FAO and WHO introduced the digestible indispensable amino acid score (DIAAS) (8), which addresses the shortcomings of the PDCAAS (Table I). Similar to the PDCAAS, the DIAAS uses the indispensable amino composition of a food and the indispensable amino acid requirements of a reference population. However, rather than total fecal nitrogen digestibility, ileal indispensable amino acid digestibility coefficients are used, and DIAAS values for single foods are not truncated at 1.0 (8,55). DIAAS values for mixed diets and sole-source foods are truncated to prevent levels of protein in diets or sole-source foods to appear higher than absolute levels. Further, as a regulatory framework, it was suggested that foods would only be eligible for a “source of protein” claim when the DIAAS for a food is ≥0.75 (8). However, this threshold could further limit the ability for high-protein plant-based foods to be identified as a source of protein.
Although the DIAAS is a more accurate reflection of protein quality, its utility within national regulatory frameworks requires further assessment. Albeit limited in scope, a recent comparison of the proposed DIAAS regulatory framework with current regulations for protein content claims in Canada and the United States showed that plant-based foods currently able to be claimed as a source of protein would not be permitted using the proposed DIAAS framework (26). Thus, adoption of the DIAAS into regulatory frameworks could antagonize efforts to increase consumption of plant-based protein. Sources of analytical error, limited availability of data, the use of animals to substantiate product claims, and upfront costs required to derive ileal digestibility coefficients should also be considered (26,35). Possible effects on national nutrition policies and public health would also require further assessment (26).
Other jurisdictions, as well as the Codex Alimentarius Commission, use absolute levels of protein as support for identifying foods as a source of protein (Table IV). In Australia and New Zealand, 5 g and 10 g per serving of food are thresholds for a “general” and “good” source of protein claims, respectively (11), whereas at least 12% energy/serving supports the lowest tier protein content claim in the EU (7) (Table IV). Codex standards (5), China (30), and South Korea (28) recognize multiple qualifiers for protein content claims when absolute levels of protein represent a proportion of the daily reference value for protein per 100 g, 100 mL, 100 kcal, or serving. 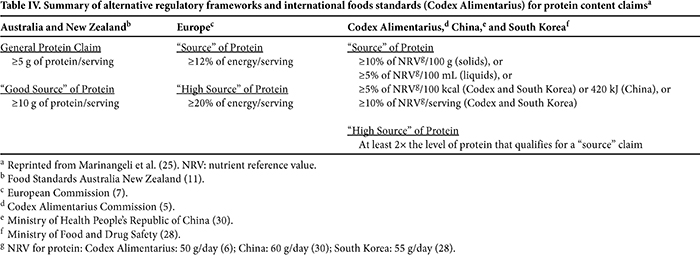
In a recent commentary, the challenges associated with Canada’s use of the protein rating method were discussed, and adoption of a regulatory framework for protein claims underpinned by absolute levels of protein was positioned as an option for regulatory modernization (25). Although there is no evidence to suggest that protein claims supported by absolute levels of protein in a food have had negative effects on food choices and quality of diets, a risk assessment would be warranted before any regulatory change took effect. Furthermore, regulations that prevent the addition of ingredients that contain single or a substantial imbalance in amino acids may require consideration (25).
Conclusions
Dietary protein has received substantial attention over the last decade. Given the linkages to health and environmental sustainability, plant-based proteins are increasingly emphasized in dietary guidelines and are resonating with consumers. Although industry stakeholders have responded with an influx of innovative and reformulated foods that incorporate proteins from legumes, seeds, nuts, and cereal grains, the regulatory environment in North America can be a hurdle for communicating protein content claims to consumers. Despite other jurisdictions that use absolute protein levels to support protein content claims, “source of protein” claims in Canada and the United States are based on protein quality. Use of the protein rating/PER method for determining the protein quality of foods marketed in Canada can be more restrictive than the PDCAAS-based system used in the United States. Thus, adoption of PDCAAS in Canada could help address challenges associated with the protein rating/PER method and further efforts to harmonize regulations. Moreover, the acceptance of in vitro methods for determining the true fecal nitrogen digestibility of protein, which is used to calculate the PDCAAS, would also expedite innovation in both countries and increase options for consumers by reducing the costly and time-consuming testing required for in vivo methods. Although the DIAAS has been put forward as a more accurate framework for assessing the protein quality of foods, a comprehensive review of its use in regulatory frameworks is required (26). The same is true for replacing protein quality with protein content to support protein claims, which is currently practiced in various regions with highly developed food systems (25). As dietary patterns, health, and environmental well-being continue to be highlighted, regulatory frameworks must be adapted to help drive changes in consumer behavior.
Acknowledgments
All authors contributed to conceptualizing and writing the manuscript. All authors have reviewed and accepted the content of the manuscript.
Conflicts of Interest
C. P. F. Marinangeli is an employee of Pulse Canada and former employee of Kellogg Canada. A. K. Shoveller and W. D. Mansilla have no conflicts to declare.
References References
- Bicks, I. Canadian farmers, companies invest in plant-based protein amid growing demand. Published online at www.theglobeandmail.com/report-on-business/canadian-farmers-companies-invest-in-plant-based-protein-amid-growing-demand/article38105245. The Globe and Mail, February 25, 2018.
- Brugård Konde, Å., Bjerselius, R., Haglund, L., Jansson, A., Pearson, M., Sanner Färnstrand, J., and Johansson, A.-K. Swedish Dietary Guidelines—Risk and Benefit Management Report. Published online at www.livsmedelsverket.se/globalassets/publikationsdatabas/rapporter/2015/rapp-hanteringsrapport-engelska-omslag--inlaga--bilagor-eng-version.pdf. National Food Agency, Uppsala, 2015.
- Canadian Food Inspection Agency. Food labeling for industry: Elements within the Nutrition Facts table—Protein. Published online at www.inspection.gc.ca/food/labelling/food-labelling-for-industry/nutrition-labelling/elements-within-the-nutrition-facts-table/eng/1389206763218/1389206811747?chap=7. CFIA, Ottawa, 2017.
- Chaudhary, A., Marinangeli, C., Tremorin, D., and Mathys, A. Nutritional combined greenhouse gas life cycle analysis for incorporating Canadian yellow pea into cereal-based food products. Nutrients 10:4, 2018.
- Codex Alimentarius Commission. Guidelines for use of nutrition and health claims. CAC/GL 23-1997. Available online at www.fao.org/fao-who-codexalimentarius/sh-proxy/en/?lnk=1&url=https%253A%252F%252Fworkspace.fao.org%252Fsites%
252Fcodex%252FStandards%252FCAC%2BGL%2B23-1997%252FCXG_023e.pdf. FAO/WHO, Rome, 2013.
- Codex Alimentarius Commission. Guidelines on nutrition labelling: CAC/GL 2-1985. Available online at www.fao.org/ag/humannutrition/33309-01d4d1dd1abc825f0582d9e5a2eda4a74.pdf. FAO/WHO, Rome, 2013.
- European Commission. Regulation (EC) No. 1924/2006 of the European Parliament and of the council of 20 December 2006 on nutrition and health claims made on foods. Published online at https://eur-lex.europa.eu/LexUriServ/LexUriServ.do?uri=OJ:L:2006:404:0009:0025:EN:PDF. Off. J. Eur. Union L 404, 30/12/2006, page 9, 2006.
- Food and Agriculture Organization of the United Nations. Dietary protein quality evaluation in human nutrition: Report of an FAO expert consultation. FAO Food and Nutrition Paper 92. Published online at www.fao.org/ag/humannutrition/35978-02317b979a686a57aa4593304ffc17f06.pdf. FAO, Rome, 2013.
- Food and Agriculture Organization of the United Nations. Research approaches and methods for evaluating protein quality of human foods: Report of a FAO expert working group. Published online at www.fao.org/3/a-i4325e.pdf. FAO, Rome, 2014.
- Food and Agriculture Organization of the United Nations and World Health Organization. Protein quality evaluation: Report of the joint FAO/WHO expert consultation, Bethesda, Md., USA, 4-8 December 1989. FAO Food and Nutrition Paper 51. Published online at http://apps.who.int/iris/bitstream/handle/10665/38133/9251030979_eng.pdf?sequence=1. FAO, Rome, 1991.
- Food Standards Australia New Zealand. Standard 1.2.7: Nutrition, health and related claims. Australia New Zealand Food Standards Code. Published online at www.foodstandards.gov.au/code/Documents/1.2.7%20Nutrition%20and%20health%20claims%20v157.pdf. Federal Register of Legislative Instruments, Barton, Canberra, Australia, 2016.
- French Agency for Food, Environmental and Occupational Health & Safety. Updating of the PNNS guidelines: Revision of the food-based dietary guidelines. ANSES Opinion: Collective expert report. Published online at www.anses.fr/en/system/files/NUT2012SA0103Ra-1EN.pdf. ANSES, Maison-Alfort, France, 2016.
- Government of Canada. Official Method FO-1: Determination of protein rating. Available online at www.hc-sc.gc.ca/fn-an/alt_formats/hpfb-dgpsa/pdf/res-rech/fo-1-eng.pdf. Health Canada, Health Protection Branch, Ottawa, 1981.
- Government of Canada. Nutrition labelling—Table of reference amounts for food: Combination dishes. Available online at www.canada.ca/en/health-canada/services/technical-documents-labelling-requirements/table-reference-amounts-food/nutrition-labelling.html#n. Health Canada, Ottawa, 2016.
- Government of Canada. Guiding principles, recommendations and considerations. Element D: Considerations—Environment. Available online at www.foodguideconsultation.ca/guiding-principles-detailed. Health Canada, Ottawa, 2017.
- Government of Canada. Food and Drug Regulations. Part B, Division 1, General, B.01.305. Government of Canada, Ottawa, 2018.
- Government of Canada. Food and Drug Regulations. Part B, Division 1, Nutrient content claims, B.01.500. Government of Canada, Ottawa, 2018.
- Government of Canada. Food and Drug Regulations. Part B, Division 1, Nutrient content claims, B.01.500, Table. Available online at http://laws-lois.justice.gc.ca/eng/regulations/c.r.c.,_c._870/page-25.html#h-45. Government of Canada, Ottawa, 2018.
- Government of Canada. Food and Drug Regulations. Schedule K—Reasonable daily intake for various foods. Available online at http://laws-lois.justice.gc.ca/eng/regulations/c.r.c.,_c._870/page-192.html. Government of Canada, Ottawa, 2018.
- Health Canada. Eating Well with Canada’s Food Guide—A Resource for Educators and Communicators. Published online at www.hc-sc.gc.ca/fn-an/alt_formats/hpfb-dgpsa/pdf/pubs/res-educat-eng.pdf. Health Canada, Ottawa, 2011.
- Hoffer, L. J. Human protein and amino acid requirements. J. Parenter. Enteral Nutr. 40:4, 2016.
- Hosafci, P. Plant-based protein: Assessing demand for sustainable alternatives. Euromonitor International, London, 2017.
- Kromhout, D., Spaaij, C. J., de Goede, J., and Weggemans, R. M. The 2015 Dutch food-based dietary guidelines. Eur. J. Clin. Nutr. 70:8, 2016.
- Li, S. S., Blanco Mejia, S., Lytvyn, L., Stewart, S. E., Viguiliouk, E., et al. Effect of plant protein on blood lipids: A systematic review and meta-analysis of randomized controlled trials. J. Am. Heart Assoc. 6:12, 2017.
- Marinangeli, C. P. F., Foisy, S., Shoveller, A. K., Porter, C., Musa-Veloso, K., Sievenpiper, J. L., and Jenkins, D. J. A. An appetite for modernizing the regulatory framework for protein content claims in Canada. Nutrients 9:9, 2017.
- Marinangeli, C. P. F., and House, J. D. Potential impact of the digestible indispensable amino acid score as a measure of protein quality on dietary regulations and health. Nutr. Rev. DOI: https://doi.org/10.1093/nutrit/nux025. 2017.
- Millward, D. J., Layman, D. K., Tome, D., and Schaafsma, G. Protein quality assessment: Impact of expanding understanding of protein and amino acid needs for optimal health. Am. J. Clin. Nutr. 87:5, 2008.
- Ministry of Food and Drug Safety. Labelling Standards for Foods. Published online at www.mfds.go.kr/eng/brd/m_15/view.do?seq=70814&srchFr=&srchTo=&srchWord=&srchTp=&itm_seq_1=0&itm_seq_2=0&multi_itm_seq=0&company_cd=
&company_nm=&page=1. MFDS, Cheongju-si, Republic of Korea, 2016.
- Ministry of Health of Brazil. Dietary Guidelines for the Brazilian Population, 2nd ed. Available online at www.foodpolitics.com/wp-content/uploads/Brazilian-Dietary-Guidelines-2014.pdf. Secretariat of Health Care, Primary Health Care Department, Brasília, Brazil, 2014.
- Ministry of Health of the People’s Republic of China. National Standards of People’s Republic of China: National Food Safety Standard, Standard for Nutrition Labelling of Prepackaged Foods. Available online at https://extranet.who.int/nutrition/gina/sites/default/files/CHN%202011%20Standard%20for%20Nutrition%20Labelling%20
of%20Prepackaged%20Foods%20-%20Unofficial%20Translation.pdf. Ministry of Health, Beijing, China, 2011.
- Mintel Group Ltd. Plant-based proteins—US—January 2018. Mintel Group Ltd., London, 2018.
- Nordic Council of Ministries. Nordic Nutrition Recommendations 2012: Integrating Nutrition and Physical Activity, 5th ed. Published online at www.norden.org/en/theme/former-themes/themes-2016/nordic-nutrition-recommendation/nordic-nutrition-recommendations-2012. Nordic Council of Ministries, Copenhagen, 2012.
- Nosworthy, M. G., Franczyk, A., Zimoch-Korzycka, A., Appah, P., Utioh, A., Neufeld, J., and House, J. D. Impact of processing on the protein quality of pinto bean (Phaseolus vulgaris) and buckwheat (Fagopyrum esculentum Moench) flours and blends, as determined by in vitro and in vivo methodologies. J. Agric. Food Chem. 65:19, 2017.
- Nosworthy, M. G., Franczyk, A. J., Medina, G., Neufeld, J., Appah, P., Utioh, A., Frohlich, P., and House, J. D. Effect of processing on the in vitro and in vivo protein quality of yellow and green split peas (Pisum sativum). J. Agric. Food Chem. 65:35, 2017.
- Nosworthy, M. G., and House, J. D. Factors influencing the quality of dietary proteins: Implications for pulses. Cereal Chem. 94:1, 2017.
- Nosworthy, M. G., Medina, G., Franczyk, A. J., Neufeld, J., Appah, P., Utioh, A., Frohlich, P., and House, J. D. Effect of processing on the in vitro and in vivo protein quality of red and green lentils (Lens culinaris). Food Chem. 240:588, 2018.
- Nosworthy, M. G., Neufeld, J., Frohlich, P., Young, G., Malcolmson, L., and House, J. D. Determination of the protein quality of cooked Canadian pulses. Food Sci. Nutr. 5:4, 2017.
- Patterson, C. A., Curran, J., and Der, T. Effect of processing on antinutrient compounds in pulses. Cereal Chem. 94:1, 2017.
- Rutherfurd, S. M., Fanning, A. C., Miller, B. J., and Moughan, P. J. Protein digestibility-corrected amino acid scores and digestible indispensable amino acid scores differentially describe protein quality in growing male rats. J. Nutr. 145:2, 2015.
- Sabate, J., and Soret, S. Sustainability of plant-based diets: Back to the future. Am. J. Clin. Nutr. 100(Suppl. 1):476S, 2014.
- Sarwar, G., Peace, R. W., and Botting, H. G. Corrected relative net protein ratio (CRNPR) method based on differences in rat and human requirements for sulfur amino acids. J. Assoc. Off. Anal. Chem. 68:4, 1985.
- Schaafsma, G. The protein digestibility-corrected amino acid score (PDCAAS)—A concept for describing protein quality in foods and food ingredients: A critical review. J. AOAC Int. 88:3, 2005.
- Schmidt, C. Global trends in protein. Euromonitor International, London, 2016.
- Shoveller, A. K., McKnight, L. M., Wood, K. M., and Cant, J. P. Lessons from animal nutritionists: Dietary amino acid requirement studies and considerations for healthy aging studies. Ann. N.Y. Acad. Sci. 1418:1, 2018.
- Simpson, S. J., Batley, R., and Raubenheimer, D. Geometric analysis of macronutrient intake in humans: The power of protein? Appetite 41:2, 2003.
- Simpson, S. J., and Raubenheimer, D. Geometric analysis of macronutrient selection in the rat. Appetite 28:3, 1997.
- Soret, S., Mejia, A., Batech, M., Jaceldo-Siegl, K., Harwatt, H., and Sabaté, J. Climate change mitigation and health effects of varied dietary patterns in real-life settings throughout North America. Am. J. Clin. Nutr. 100(Suppl. 1):490S, 2014.
- U.S. Department of Agriculture, Agricultural Research Service. USDA National Nutrient Database for Standard Reference, release 28. Published online at https://ndb.nal.usda.gov/ndb. Nutrient Data Laboratory Research Service, Riverdale, MD, 2018.
- U.S. Department of Agriculture and Department of Health and Human Services. Dietary Guidelines for Americans, 2015–2020, 8th ed. Published online at https://health.gov/dietaryguidelines/2015/guidelines. U.S. Government Printing Office, Washington, DC, 2015.
- U.S. Department of Agriculture and Department of Health and Human Services. Scientific Report of the 2015 Dietary Guidelines Advisory Committee. Published online at http://health.gov/dietaryguidelines/2015-scientific-report/pdfs/scientific-report-of-the-2015-dietary-guidelines-advisory-committee.pdf. U.S. Government Printing Office, Washington, DC, 2015.
- U.S. Food and Drug Administration and Department of Health and Human Services. Nutrient content claims for “good source,” “high,” “more,” and “high potency.” 21 CFR, Part 101, Subpart D, Section 101.54. Electronic Code of Federal Regulations. Published online at www.ecfr.gov/cgi-bin/retrieveECFR?gp=&SID=bad23c28ebd662323b3ace1e3f5ee94f&mc=true&n=pt21.2.101&r=PART&ty=HTML#se21.2.101_154. Government Printing Office, Washington, DC, 2018.
- U.S. Food and Drug Administration and Department of Health and Human Services. Nutrient content claims—General principles. 21 CFR, Part 101, Subpart A, Section 101.13. Electronic Code of Federal Regulations. Published online at www.ecfr.gov/cgi-bin/retrieveECFR?gp=&SID=bad23c28ebd662323b3ace1e3f5ee94f&mc=true&n=pt21.2.101&r=PART&ty=HTML#se21.2.101_113. Government Printing Office, Washington, DC, 2018.
- U.S. Food and Drug Administration and Department of Health and Human Services. Nutrition labeling of food. 21 CFR, Part 101, Subpart A, Section 101.9. Electronic Code of Federal Regulations. Published online at www.ecfr.gov/cgi-bin/text-idx?SID=632b6dad08d562ed1705c691778481d8&mc=true&node=se21.2.101_19&rgn=div8. Government Printing Office, Washington, DC, 2018.
- U.S. Food and Drug Administration and Department of Health and Human Services. Reference amounts customarily consumed per eating occasion. 21 CFR, Part 101, Subpart A, Section 101.12. Electronic Code of Federal Regulations. Published online at www.ecfr.gov/cgi-bin/text-idx?SID=a7f65174b0fd6d77a0bf7dbd407c6b77&mc=true&node=se21.2.101_112&rgn=div8. Government Printing Office, Washington, DC, 2018.
- Wolfe, R. R., Rutherfurd, S. M., Kim, I. Y., and Moughan, P. J. Protein quality as determined by the digestible indispensable amino acid score: Evaluation of factors underlying the calculation. Nutr. Rev. 74:9, 2016.
- World Health Organization, Food and Agriculture Organization of the United Nations, and United Nations University. Protein and amino acid requirements in human nutrition: Report of a joint FAO/WHO/UNU expert consultation. WHO Tech. Rep. Ser. 935. WHO, Geneva, 2007.
|
