|
|
03 Issues & Trends
Cereal Foods World, Vol. 64, No. 6
DOI: https://doi.org/10.1094/CFW-64-6-0068
Print To PDF
DisplayTitle Using Digital Agriculture Technologies to Improve Nitrogen Management and Wheat Yield
Authors Haiying Tao1 and David S. Bullock2
Affiliations
© 2019 Cereals & Grains Association
Abstract
CFWAbstract Nitrogen (N) management is an important factor in wheat yield and quality. Unfortunately, most commonly used N recommendation methods fail to lessen the variabilities and uncertainties of N management. Until recently, advances in scientific methods for deriving N recommendations and developing management strategies required large amounts of small-plot N research data collected from many locations across many years. However, this traditional method of data collection is prohibitively expensive on a large scale. Field-scale, on-farm precision experimentation (OFPE) uses precision agriculture technologies to efficiently and economically collect data from entire production fields. Such data can be used to inform statistical, mathematical, and economic models, which can be applied to develop prediction models and decision support tools. Knowledge and tools derived from OFPE can be used to develop more reliable, site-specific N recommendations.
Trying to reach content?
View Full Article
if you don't have access, become a member
Page Content Current Methods of Deriving Nitrogen Fertility Management Recommendations for Wheat Production
In wheat production, the goal of nitrogen (N) fertility management is to apply N at profit-enhancing rates, taking into consideration the fact that both yield and quality affect the market value of the output. In terms of social costs, an N management strategy also should reduce the risk of environmental pollution. Proper N management is especially important for wheat, because market prices for wheat can be based on protein concentration, which is directly affected by N management. However, N fertility management for wheat is extremely challenging because N can be lost from soils through many different pathways and mechanisms. How N is lost at any given location depends on interactions among soil, weather conditions, cropping system, field management practices, and the form, application timing, and application method used for the fertilizer. Frequent fluctuations in commodity prices add more uncertainty to decisions concerning N management.
Current N recommendations for wheat are mainly based on the yield goal method, which originated from Stanford’s (10,11) N fertility studies of corn production. This method estimates N fertilizer rate using a mass balance approach that adjusts unit N requirement (UNR) for yield based on soil N supply and N fertilizer use efficiency (NUE) under non–nitrogen-limited conditions. Many states provide no guidance on how to set a realistic yield goal, while others suggest a variety of methods, such as using a 5 year average yield or the average of the best yields from 3 or 4 years out of the previous 5 years (6). Numerous studies have provided empirical evidence rejecting the yield-based approach, however, due to its over simplification of complicated N management strategies in the agroecological and socioeconomic system (5,9,12,13).
Estimating optimal N fertilizer rates and UNRs for wheat is complicated further by other site-specific conditions and interacting factors. For example, N mineralized from soil organic matter (SOM) is one of the most important components of soil N supply. The amount of this type of N varies, however, depending on type and amount of plant residue, SOM content, proportion of different SOM pools, soil pH, soil management practices, and annual weather conditions. The NUE also varies significantly with total annual rainfall, amount of rainfall per event, soil type, soil drainage class or drain tile system, crop rotation, tillage, and other management factors. Most importantly, the UNRs provided to farmers by land-grant universities are often based on averages derived from relatively few small-plot research trials. For example, for each bushel/acre yield, Washington State University (WSU) recommends used of 2.7 ± 0.2 lb of N/acre for soft white winter wheat and 3.0 ± 0.2 lb of N/acre for hard red and hard white winter wheats. Under real production conditions, however, the UNR can vary substantially within and across fields and from year to year. Pan et al. (7) found that the UNR for spring canola varied from 7 to 17 kg of N/kg of grain across 12 site years. This spatial and temporal variability poses a challenge to farmers and farm consultants trying to estimate values for all interacting factors that can influence the “4 R’s” of efficient N management: right rate, right place, right form, and right timing. Some farmers use a variable-rate N fertilization method that was developed using average yield, based on historical yield maps or on vegetation indices derived from satellite imagery. These maps use a single UNR recommended by a land-grant university, however, and fail to lessen the uncertainties inherent in predicting yield and quality response to components, such as soil N supply and NUE, utilized in the yield goal method.
Capturing data on this within- and across-field spatial and temporal variability to reduce uncertainties in current N recommendation systems would require gathering large amounts of small-plot research data from many locations and across many years. However, small-plot research trials are time-consuming, labor-intensive, and, thus, prohibitively expensive to conduct on a large scale and over the long run. Consequently, studies using small-plot research are typically only run in a few locations for a few years and on very small areas of land, typically far less than 1 ha. As a result, the inference spaces of small-plot studies are small. It is often unclear if the inferences derived from small-plot trials can be applied for input management in other parts of the fields in the same year—let alone for other fields across the county or state in weather conditions different from those encountered where the trials were conducted. In recent years, replicated on-farm “strip trials” have been conducted with the stated purpose of generating data for more reliable recommendations for corn production management (4). Unfortunately, despite providing information about larger areas of land, strip trials poorly capture spatial variability and are especially inconvenient for hilly fields.
Improving Current Nitrogen Recommendations Using On-Farm Precision Experimentation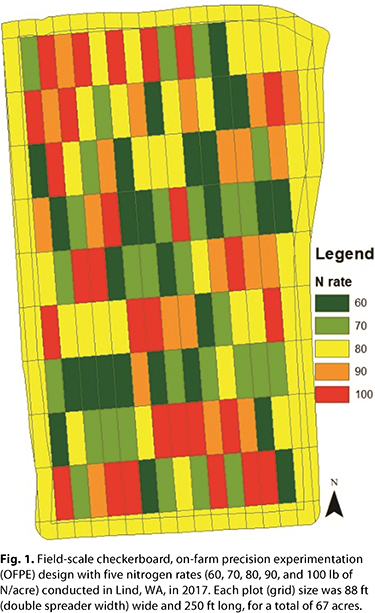
Field-scale, on-farm precision experimentation (OFPE) uses precision agriculture technologies to efficiently and economically collect large-field trial data from entire production fields. OFPE data provide several advantages over small-plot and strip-trial data. With OFPE data, it is possible to use advanced statistical, mathematical, and economic models to better understand crop yield and quality response to nutrient inputs under different field and weather conditions. For example, we can calculate how output (e.g., wheat yield, protein concentration, test weight) changes in response to varying nutrient input application rates under various field management practices (e.g., tillage, crop rotations, residue management), field characteristics (e.g., topography; microclimate; soil chemical, physical, and biological properties), and weather (e.g., rainfall, extreme temperature fluctuation, growing degree days). Consequently, the knowledge derived from OFPE trials can be used to develop recommendations with greatly reduced uncertainties.
Bramley et al. (1) described a few types of OFPE designs, and Wang et al. (14) described a satellite imagery-guided sampling approach for OFPE research. One example of OFPE is the randomized “checkerboard” design shown in Figure 1. In this design, each grid is randomly assigned a treatment. The grid size is determined by field characteristics and equipment specifications (e.g., width of applicator, planter, or combine header). The flexibility of an OFPE design is valuable in fields with complicated topographical characteristics, because treatments can be assigned randomly based on the spontaneous patterns in which farm equipment must be driven. These spontaneous patterns can be due to steep slopes or wet field conditions (Fig. 2). Procedures for conducting OFPE trials are presented in Figure 3. The Data-Intensive Farm Management (DIFM) Project, led by David S. Bullock at the University of Illinois (https://publish.illinois.edu/data-intensive-farm-managment), and the On-Farm Precision Experiment Project, led by Bruce Maxwell at Montana State University, are currently developing online tools for various types of OFPE designs. 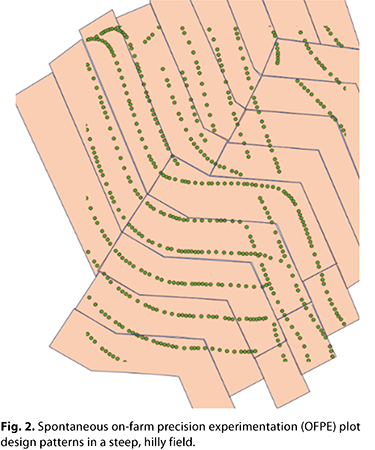
Because field-scale OFPE trials can be conducted efficiently on large numbers of commercial farm fields, they generate specific information from those fields about those fields. These on-farm data are immediately pertinent to decisions about future management of each field within the farm operation and transferable to fields with similar conditions. In contrast, the small amount of generalized data obtained from small-plot studies is less likely to pertain to fields located in places other than the study sites. Furthermore, the labor required for scientists to implement OFPE trials is much less onerous than the labor required for small-plot research. OFPE procedures take advantage of the capabilities of GPS and the farmers’ precision agriculture equipment (e.g., variable rate fertilizer applicators, variable seeding rate planters or drills, and variable herbicide sprayers), which automatically record the treatment and planting data. Then, at harvest, yield and protein data are collected in real-time using georeferenced, combine-mounted yield monitor and protein sensors (2).
Inexpensive data on the factors that significantly effect N availability for crops are readily available. For example, U.S. Department of Agriculture Natural Resources Conservation Service (USDA-NRCS) SSURGO soil maps are provided by the University of California (https://casoilresource.lawr.ucdavis.edu/soilweb-apps). Other soil property layers can be mapped using several types of on-the-go soil sensors (8). These sensors can create high-resolution electrical conductivity, pH, and SOM maps. Low-cost, high-resolution satellite imagery, such as RapidEye (BlackBridge) and Google Earth Engine (https://earthengine.google.com), or aerial imagery (airplane or drone) provided by many local companies are easy to obtain and can be used to calculate vegetation indices (e.g., normalized difference vegetation index and normalized difference red edge). These indices may provide insight into the within-field spatial and temporal variation of crop properties. Some farmers have installed weather stations in their own fields, and free weather station data or 4 km grid resolution and radar maps of daily weather conditions are readily available from the National Climate Data Center archive (http://www.ncdc.noaa.gov/cdo-web). If a field is hilly, a 3D elevation program (3DEP) (https://viewer.nationalmap.gov/basic) can provide an extremely useful layer of data. For example, 3DEP can calculate a variety of indices, such as slope, aspect, topographic wetness index, total solar radiation, and total terrain surface curvature. 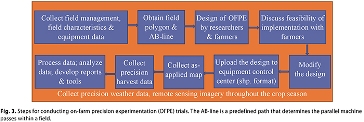
Database management and data processing are key challenges for OFPE research. Scientists recognize these issues and have started developing tools to support such tasks (2). With the rapid development of digital agriculture technologies, the management challenges for large agricultural databases have caught the attention of both the private sector (e.g., The Climate Corporation and Ag-Analytics) and public universities (e.g., the DIFM group at the University of Illinois and the WSU Farmers Network [http://farmersnetwork.wsu.edu]).
The spatial and temporal variability of OFPE data present both opportunities and challenges. Commonly used statistical methods for small-plot research data generally are inappropriate due to spatial and temporal autocorrelation, but many other suitable approaches are readily available, such as geostatistical and spatial-econometric models. Machine-learning approaches (e.g., neural networks, random forest, deep learning, and support vector machine) are useful for developing learning algorithms and predictions based on OFPE data (3). Future development of an agricultural cyber infrastructure will provide seamless integration of computation, decision support, networking platforms, information management, and real-time systems for OFPE data measured across numerous spatial and temporal scales.
Knowledge derived from OFPE can be used to develop precision-based N recommendations that consider important, site-specific factors that affect N availability and N loss in every component of current recommendation systems. This improved accuracy will substantially enhance the success of employing the 4 R’s of nutrient stewardship in N management strategies for wheat and, in turn, increase wheat yields and ensure target protein concentrations.
References References
- Bramley, R., Cook, S., Adams, M., and Corner, R. J. Designing your own on-farm experiments: How precision agriculture can help. Grains Research & Development Corporation, Kingston, ACT, Australia, 2006.
- Bullock, D. S., Boerngen, M., Tao, H., Maxwell, B., Luck, J. D., Shiratsuchi, L., Puntel, L. A., and Martin, N. The Data-Intensive Farm Management Project: Changing agronomic research through on-farm precision experimentation. Agron. J. DOI: 10.2134/agronj2019.03.0165. 2019.
- Chlingaryan, A., Sukkarieh, S., and Whelan, B. Machine learning approaches or crop yield prediction and nitrogen status estimation in precision agriculture: A review. Comput. Electron. Agric. 151:61, 2018.
- Kyveryga, P. M., Mueller, T. A., and Mueller, D. S. On-farm replicated strip trials. Page 189 in: Precision Agriculture Basics. D. K. Shannon, D. E. Clay, and N. R. Kitchen, eds. American Society of Agronomy, Crop Science Society of America, and Soil Science Society of America, Madison, WI, 2018.
- Lory, J. A., and Scharf, P. C. Yield goal versus delta yield for predicting fertilizer nitrogen need in corn. Agron. J. 95:994, 2003.
- Morris, T. F., Murrel, T. S., Beegle, D. B., Camberato, J. J., Ferguson, R. B., et al. Strengths and limitations of nitrogen rate recommendations for corn and opportunities for improvement. Agron. J. 110:1, 2017.
- Pan, W. L., Maaz, T. M., Hammac, W. A., and Koenig, R. T. Mitscherlich modeled canola nitrogen requirements influenced by soil nitrogen and water. Agron. J. 108:884, 2016.
- Perron, I., Cambouris, A. N., Chokmani, K., Vargas Gutierrez, M. F., Zebarth, B. J., Moreau, G., Biswas, A., and Adamchuk, V. Delineating soil management zones using a proximal soil sensing system in two commercial potato fields in New Brunswick, Canada. Can. J. Soil Sci. 98:724, 2018.
- Rodriguez, D. G. P., Bullock, D. S., and Boerngen, M. A. The origins, implications, and consequences of yield-based nitrogen fertilizer management. Agron. J. 111:725, 2019.
- Stanford, G. Nitrogen requirements of crops for maximum yield. Page 237 in: Agricultural Anhydrous Ammonia Technology and Use. M. H. McVickar, W. P. Martin, I. E. Miles, and H. H. Tucker, eds. American Society of Agronomy and Soil Science Society of America, Madison, WI, 1966.
- Stanford, G. Rationale for optimum nitrogen fertilization in corn production. J. Environ. Qual. 2:159, 1973.
- Vanotti, M. B., and Bundy, L. G. An alternative rationale for corn nitrogen fertilizer recommendations. J. Prod. Agric. 7:243, 1994.
- Vanotti, M. B., and Bundy, L. G. Corn nitrogen recommendations based on yield response data. J. Prod. Agric. 7:249, 1994.
- Wang, K., Huggins, D. R., and Tao, H. Rapid mapping of winter wheat yield, protein, and nitrogen uptake using remote and proximal sensing. Int. J. Appl. Earth Obs. Geoinf. 82:1, 2019.
|
